For my final project I constructed two maps which represent two different areas from my native country Moldova. In my first map I used proportional symbols technique to map nitrates pollution of wells from one of the country villages. My second map represents the land use of South Moldova. For this map I used choropleth mapping. Both maps are generated based on real data which come from research made in last few years at different organizations. Also I chose to use these data as there are in different ways related to me. In one project I took part as a contractor while the data from other I am using for my MS thesis.
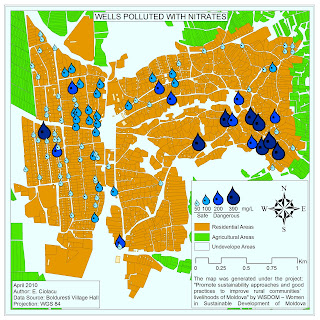
Map 1: Wells Polluted with Nitrates
The map represents wells in Bolduresti village and its level of nitrates pollution. Mapped area is located in the western part of Moldova and represents a village with a population round of 3500 inhabitants. The data on which the map is based came from WiSDOM - Women in Sustainable Development of Moldova organization from the project “Promote Sustainability Approaches and Good Practices to Improve Rural Communities’ Livelihoods of Moldova”. In this project my duties was to map all wells from where was taken water samples. Because the project has as a goal also to involved local people all the samples was taken by the local school children. From the beginning it was planned to take 100 hundreds of water samples. This number of samples did not cover all village wells but was assumed that will give a general overview of situation. All samples were tested in the same day for pH and nitrates at Institute of Chemistry from Academy of Sciences of Moldova at ion meter.
In order to represent the nitrate values in an accessible way for general public I used proportional symbols technique. I divided all values in four groups:
Up to 50 mg/l – which is considered safe by the low
Up to 100 mg/l – which is considered safe too by different health organization
Up to 200 mg/l and 390 mg/l which are not safe. I broke this in two classes in order to have a more homogeneous classification.
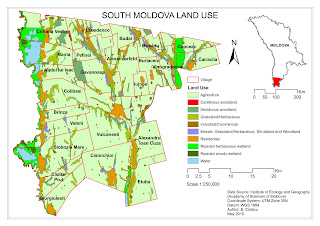
Map2: South Moldova Land Use
The map represents the land use in the south part of the country. The map represents ten different types of land utilization in mapped area. The data came from a project made at National Institute of Ecology, in present Institute of Ecology and Geography from Academy of Sciences of Moldova. The project “Delineation of Environmentally Sensitive Areas in Republic of Moldova: GIS Aproach” the data came from took place in 2003-2005.
In order to represent land use I used a choropleth map technique with a qualitative color scheme.
